Archive
How to monitor your Internet facing service globally – #Azure, #ApplicationInsights, #Citrix, #NetScaler, #EnvokeIT
Hi again all!
It’s been quite a long time since I wrote a blog post.. I’ve just been too busy working! 🙂
But this is a really cool capability that I think that many of you will like, how often do your company or service provider have a good way of monitoring availability, performance etc. from the public Internet? And if they do then most of the time the larger service providers will build a service and install their own probes on different geographical locations and then they charge quite a lot for this service, and every time you change your application the charge you again for modifying the scripts that the probes use etc.
What I’ve tried and now think is going to be great for both smaller and larger organisations is the Azure Application Insights service. It’s really great and can assist with just this, it’s a service that microsoft provide from their locations globally where you can test your apps in Azure or course but also any web site out there on the Internet. And it doesn’t stop there, you can also use the server installer to also provide metrics from your Windows IIS server up to Azure to get more detailed statistics about the web server itself and requests etc.
Just think about how much it would take for you to setup monitoring from APAC, Americas and Europe for your NetScaler environment.. that would not be done in 10 minutes if you talk to your standard service provider. It took me 10 minutes to setup this reporting to ensure that the NetScaler is available from different locations around the world:
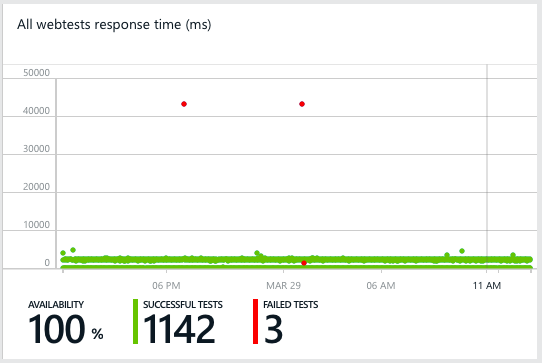
And this is just a simple url ping test to ensure that we get a proper 200 OK response from our EnvokeIT Lab environment that my colleague Björn have setup and modified so nicely with the X1 StoreFront look & feel.


Of course you can make a more proper test than just a url ping test like in this case, the service supports multi-step tests and also content matching etc. It’s also very easy to create one application/service that then consists of multiple locations that you want to monitor, for instance if you’re using GSLB FQDNs as well as regional to ensure that you get the full picture.
More information about what can be done you can find on the Azure Application Insights page. Read more…
#Citrix #NetScaler Insight (NI) – Citrix TV videos
Citrix has released some videos related to NetScaler Insight. Have a look at them and try it out!
Setting up NetScaler Insight 1.0
NetScaler Insight – Adding NetScaler Instances to NetScaler Insight
Application visibility using NetScaler Insight
NetScaler Insight – Adding NetScaler Instances to NetScaler Insight
Cheers!
//Richard
Command Center 5.1 Beta – A Complete New Face!
Ok, found another good and interesting blog post from Citrix. Even though this is great and I’ll try it out but I’m still awaiting more from Citrix on end-to-end monitoring and reporting… but lets give this beta a go! 🙂
This release, I am thrilled to unveil a new Face of Command Center!
Command Center 5.1 brings a fresh new appeal with an Absolute User Interface revamp. The new UI flaunts more organized and intuitive navigation which has been introduced with the aim to bring consistency across all the Citrix networking products.

The 5.1 release adds to Command Center’s analytics streak by introducing AGEE Syslog analytics. It breaks open the Syslogs into meaningful graphs and pie charts, laying out top 10 parameters of SSLVPN usage. The AGEE Syslog analytics answers questions raised around SSLVPN usage which comes across in day to day administration:
- Which are the top user sessions?
- Which are the top ICA application being used?
- Which users are consuming high bandwidth?
- While accessing VPN, which client type amongst ICA, Clientless or Agent has been used most ?
- Which users didn’t match EPA scan policies?
- Which users have had the most failed login attempts?
On top of these, it also lets you view the.. continue reading here!
//Richard


